
Utilizing Data Science to Better Understand Cities
The narratives we construct about our environment helps to shape how we perceive, understand, and interact with the world around us. In an era of plentiful and intensifying data compilation, our narratives beyond the stories we tell about a place to include how we bolster those stories with data sets, data visualization, and analysis. Over the fall 2023 semester, a course led by DUSP’s Cong Cong, developed core data competencies in the context of student selected case studies to enable students to explore and visualize urban environments.
11.S187/11.S954, Applied Data Science for Cities, encouraged students to blend an analysis of quantitative data and data visualization with additional forms of data and community engagement to design tools for use in decision-making and policy development settings. Final projects, presented in December, included:
- An interactive platform to explore spatial equity, measured in access to public resources, across Boston neighborhoods.
- Access to public transit infrastructure in Mexico City.
- Mapping and measuring the impact of lack of access to grocery stores in Boston neighborhoods.
- Mapping and measuring the victims, hotspots, and data sources about human trafficking globally.
- An analysis of the viability and benefits of utilizing land owned by religious institutions for future affordable housing development.
- An analysis of environmental injustices in Chelsea, Massachusetts.
- Mapping and understanding how flood resilience infrastructure in Louisiana intersects with socio-economic demographics.
- An assessment of pedestrian and bicyclist safety in Cambridge, MA.
- An experiment in color for finding a sense of place in cities
- Examining access and equity in water infrastructure in Istanbul
- Identifying challenges for incoming migrants to New York City through data analysis.
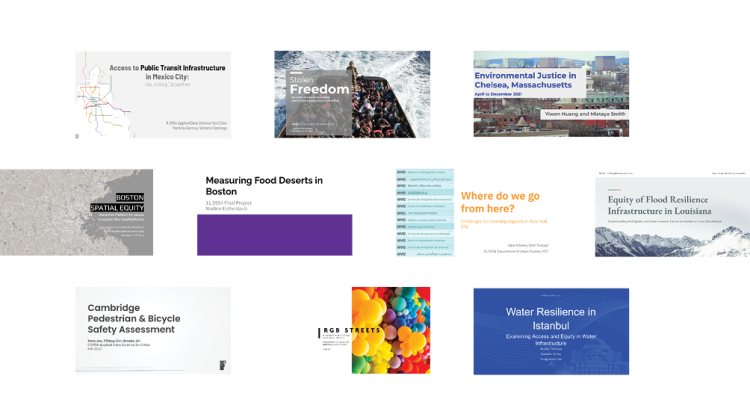
A selection of images from student presentations can be seen below:
- Image
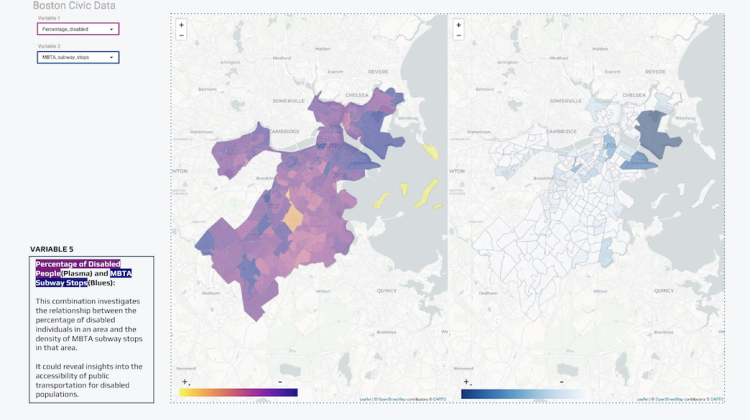
Boston Spatial Equity. Credit: Sofia Chiappero, Cale Wagner, Mikel Berra.
- Image
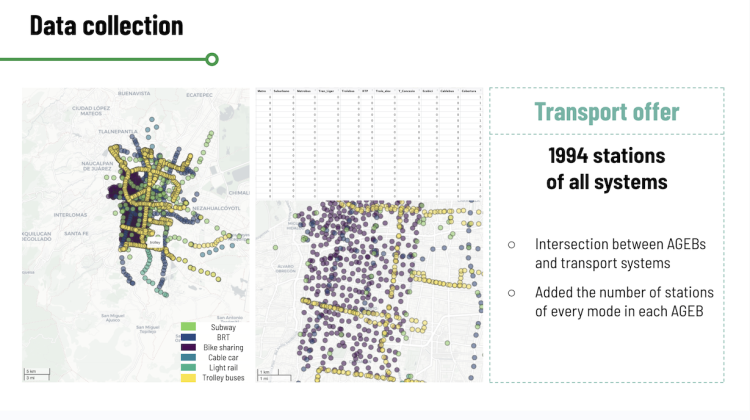
Access to Public Transit Infrastructure in Mexico City. Credit: Patricia García, Victoria Santiago.
- Image
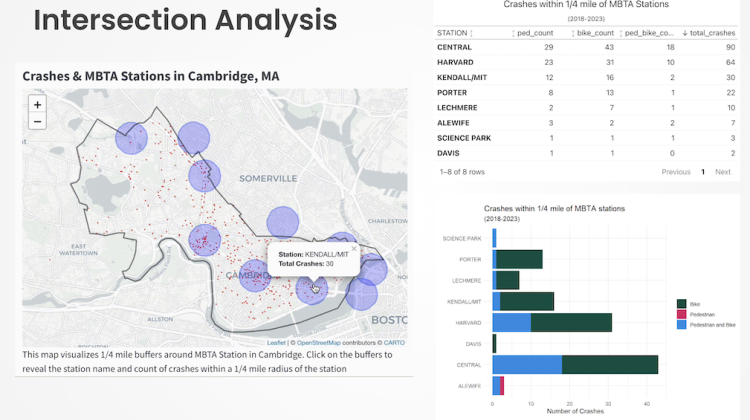
Cambridge Pedestrian & Bicycle Safety Assessment. Credit: Sara Jex, Tiffany Lim, Brooke Jin.
- Image
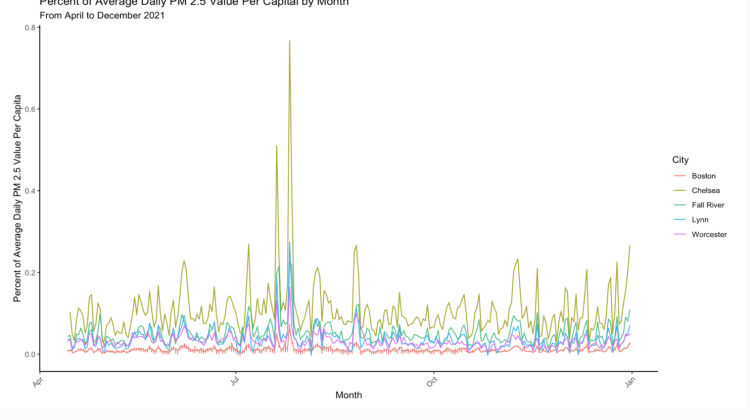
Environmental Justice in Chelsea, Massachusetts. Credit: Yiwen Huang and Mistaya Smith
- Image
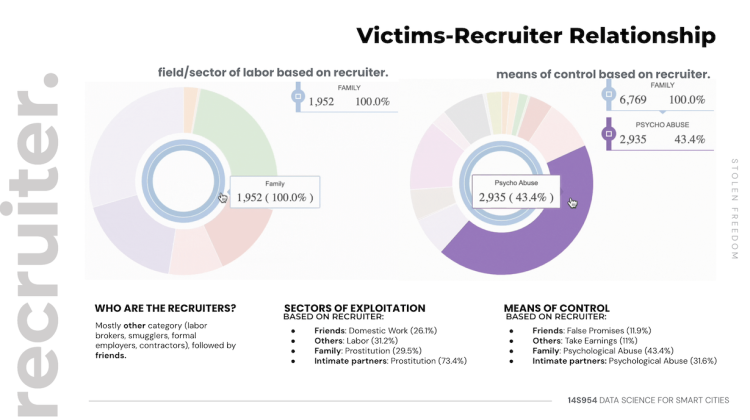
Stolen Freedom. Credit: Linh Trinh, M Ramadani.
“I've always been interested in the intersection of programming and urban challenges. I developed this course to equip students with practical tools to articulate, communicate and solve problems. The quality and innovation of the students' final projects have profoundly impressed me," said Cong Cong, who designed and taught the course last fall term. "My hope is for the course to continue evolving, inspiring students not just to learn coding but to apply their skills directly to real-world problem solving.”
Cong is a Lecturer in Course 11-6. She is interested in the areas of urban analytics and urban system modeling. She currently teaches GIS and R at DUSP and focuses on developing cross-disciplinary workshops and materials.
Students in the class included: Sofia Chiappero, Cale Wagner, Mikel Berra, Patricia García, Victoria Santiago, Nadine Eichenlaub, Linh Trinh, Muhammad Rizki Ramadani, Nicole Wong, Zak Davidson, Yiwen Huang, Mistaya Smith, Adeposi Adeogun, Hannah Leung, Chenhan Shao, Sara Jex, Tiffany Lim, Brooke Jin, Sungmoon Lim, Archer Thomas, Kareem El-Sisi, Adi Kupershmidt, Beth Tesfaye, and Yabework Abebe Kifetew.