Leveraging Interactive Data Visualization for Housing Affordability


The median rent in the Greater Boston area is $2,740. The average monthly rent in Cambridge is $3,614. To buy a home in Cambridge, you need nearly a million dollars.1 While it is recommended that households spend 30% of their monthly income on housing, more than half (51%) of Bostonians have to spend more than that just to keep themselves housed.2 These characteristics make the Greater Boston region the third most expensive housing market in the US, for both buyers and renters. What are some of the pathways available to policy makers, organizations and institutions seeking to address the housing crisis in Greater Boston?
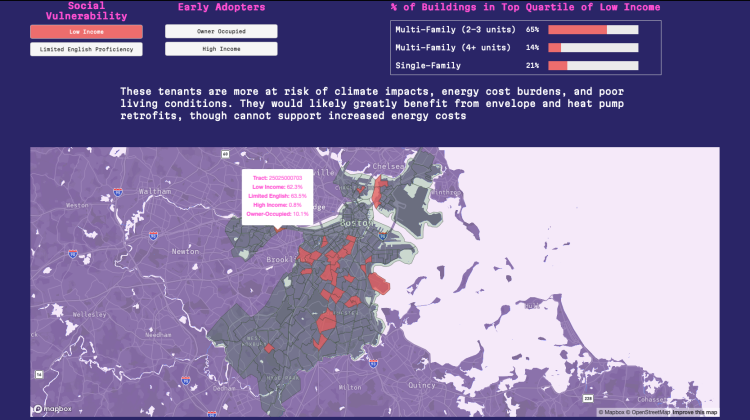
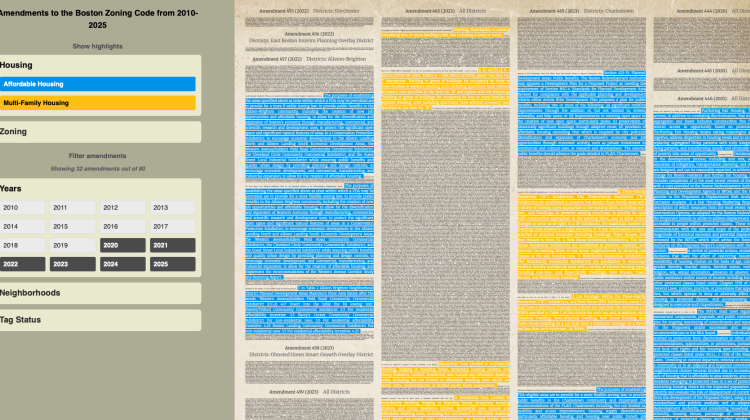
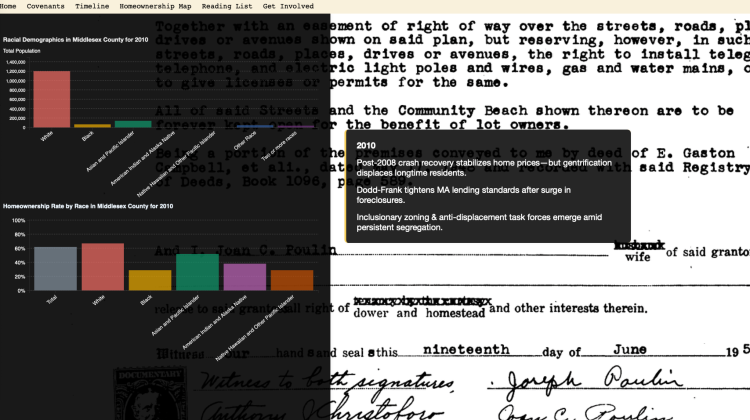
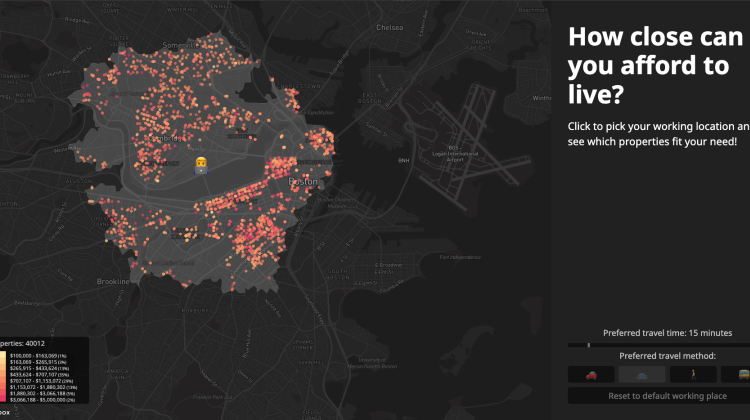
In the spring of 2025, students in Interactive Data Visualization & Society worked in teams to build digital tools such as dashboards, scrolling narrative stories, and games to drive public awareness, engagement, and problem solving for the housing affordability challenge in Boston. Over 120 interdisciplinary students were drawn from across the Institute and utilized collaboration with the Metropolitan Area Planning Commission (MAPC) as well as experts in state-level policies, such as the Affordable Homes Act and the MBTA Communities Act, to explore the landscape of attempts to ameliorate the housing crisis.
Interactive Data Visualization & Society empowers students to explore, understand, and wrangle difficult data sets; utilize those data sets to drive impactful visualizations; and design visualizations that make engaging with complex challenges easier and more accessible to a more diverse audience. The course is offered annually and each iteration of the class works with a “client” focusing on a theme that is salient to the client’s work. MPAC was the client for this year’s course, a public planning agency whose goals are to promote regional collaboration around the following goals: sound municipal management, sustainable land use, protection of natural resources, efficient and affordable transportation, a diverse housing stock, public safety, economic development, clean energy, healthy communities, an informed public, and equity and opportunity. MAPC serves the 101 cities and towns in the Greater Boston Area.
Interactive Data Visualization & Society is designed and taught by DUSP's Catherine D'Ignazio, Crystal Lee (CMS/W and IDSS) and Arvind Satyanarayan (EECS). Teaching assistants for the course included Dana Hua, Sophia Zheng, Simone Peter, Riccardo Fiorista, Ane Zuniga, and Zoe De Simone.
The student teams will present their projects at a public showcase on Monday, May 12th, 2025 from 1:15PM to 2:30PM in the Lobby of the MIT College of Computing (Building 45, 51 Vassar St).
1. https://www.zillow.com/home-values/3934/cambridge-ma/
2. https://homesforprofit.mapc.org/report


